Who Wants to Find the Right Microscope for the Right Application and Scale?
Digital
Colour Brightness[1] and True Colour 3D[2] are New Tools for Investigation
Written by Sabine K McNeill at www.3d-metrics.me
Email: [email protected]
Introduction
It is always fascinating to see something we haven’t seen before. It is often mind blowing to see so much more detail that microscopes reveal. And now it is truly ‘eye opening’ when we re-visualise images, including those produced by microscopes, in True Colour 3D. This is a new kind of 3D with visual and numerical characteristics that have metric implications.
The eye opening takes place when we tilt the Mona Lisa painting or the colourful OKI elephant:

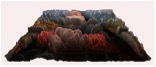
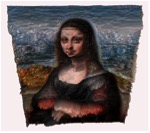
Mona Lisa re-visualised as
movable object in True Colour 3D – first horizontal,
then tilted:
http://www.smart-knowledge-portals.uk/projects/177

From the home page of www.oki.com to 'Set your Imaginations Free':http://www.oki.com/eu/printing/index.html
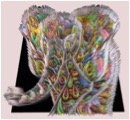
Re-visualised http://www.smart-knowledge-portals.uk/projects/316
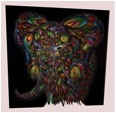
'Numerically inverted' where Black becomes White and White becomes Black
Microscopy is most important for investigating cells and MicroscopeMaster publishes a short history of cell theory[3] as the foundation for biological sciences, where cells are the fundamental unit.
When our software re-visualises digital images produced by microscopes, our fundamental unit is the number that the technology of light and colour creates. We confirm Pythagoras’[4]: all things are number[5].
[4] https://en.wikipedia.org/wiki/Pythagoras
[5] https://en.wikiquote.org/wiki/Pythagoras
Re-visualisations
by our Smart Knowledge Engine on http://www.smart-knowledge-portals.uk/projects/325
As students we may be satisfied with just seeing new aspects. As teachers we may want to suggest systematic research into comparisons that can now be carried out thanks to visualising Digital Colour Brightness – the numerical representation[6] of what the image shows: stem or blood cells, organic or anorganic materials relating to biology, chemistry or physics.
How to Become a Microscopist[7] is described on www.study.com
From A to Z – Introduction to Your Microscope[8] by MicroscopeMaster covers the field so that you can buy your own microscope and undertake your own studies.
This article is an invitation to contribute to knowing more by seeing more – and by using visual and numerical comparisons to describe what we’re seeing, observing and concluding.
[6] https://en.wikipedia.org/wiki/Grayscale#Numerical_representations
[7]http://study.com/articles/How_to_Become
_a_Microscopist_Education_and_Career_Roadmap.html
Making Digital Use of the
Numerical Representation of Images

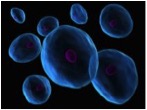
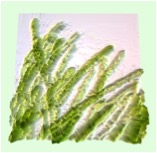
Green Algae in Brightfield Microscopy[9]
[9] https://www.microscopemaster.com/microscopy-imaging-techniques.html
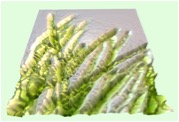
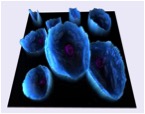
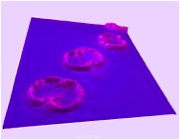
Re-Visualized in True Colour 3D http://www.smart-knowledge-portals.uk/projects/326
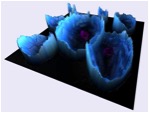
Re-Visualized with 'numerical inversion' with green as 'mountains' rather than 'valleys' as on the left
I am a mathematician and former software diagnostician at CERN, the European Centre for Nuclear Research in Geneva where the web was born, working with a highly experienced developer. We are treating images as matrices of numbers.
However, every imaging technique and every microscopy imaging technology, has its own way of translating the physics of light and colour into the digits that represent the biology of cells, the chemistry of elements or whatever we study under a microscope. Maybe our own blood or skin?
The numerical representation is weighted to fit the sensitivity of the human eye. But we use the numbers to compare images with each other numerically:
- As a whole: we could immediately spot whether an image has been tampered with or simply uses different dyes as with these stem cells below:
 |
 |
 |
 |
- particular REGIONS OF INTEREST could be compared: I’d like to automate our system to count blood and cancer cells and to formulate the characteristics of cells within ‘normal’ and ‘exceptional’ boundary conditions:
 |
 |
 |
 |
|
Healthy blood cells on http://www.smart-knowledge-portals.uk/projects/201 |
Bowel cancer cells on http://www.smart-knowledge-portals.uk/projects/198 |
- and then we could compare series of images or changes over time within such series.
Horses for Courses or
Microscopy Techniques for Applications and Scale
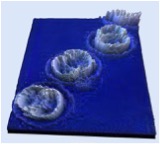
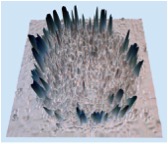
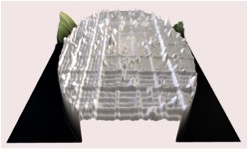
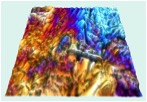
 Sugar Crystals under a Darkfield Microscope |
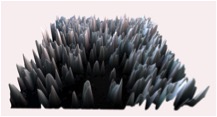
Re-Visualised:
http://www.smart-knowledge-portals.uk/projects/327 |
Visual Comparisons
True Colour 3D is the ‘screen space’ within which to explore the look and feel of images as movable objects. This is a channel of videos[10] recording interactions with the software:
- the ‘scene’ can be lit in any background colour;
- five different lights can be used to highlight ‘virtual situations’ of biological, chemical, physical or medical conditions;
- the ‘surface’ of the image can be coloured by giving it a different ‘tint’;
- the structure of how the elements of the image are connected can be highlighted by making the ‘wireframe’ visible or not;
- the ‘drama of contrast’ can be attenuated;
- and the numerical representation can be ‘inverted’ so that valleys become mountains and mountains become valleys.
These are all user controls so that we can tell ‘image stories’ by shining the best possible lights at images as a whole and their parts.
[10] https://www.youtube.com/channel/UCZFjdZADoElxKb_7rcjiDEg
First we had images telling us more than 1,000 words. Now we have their re-visualisations in True Colour 3D that give us opportunities for analysis and metrics and thus insights and intelligence, if we have eyes to see. Many analysts like to use data to fit their models.
But when you see what is there without bias and expectation and when you begin to interpret what you see and try to make sense of it, then you will gain insights. Then you will understand what the data is telling you.
You will gain the intelligence with which to interpret what you see, for you understand how the records of a data base form a whole picture or the columns and rows of an image become an object in True Colour 3D.
The challenge that I’d like to investigate is the quality of imaging and microscopic techniques:
- what is the range of numbers that represent light and colour as a numerical pixel value?
- how does the magnification of a microscope influence this range of numbers?
- are there reference images of colours to compare imaging technologies?
Recently I wrote an article for Image Reports[11] and discovered the International Colour Consortium[12] in the process. Our Smart Knowledge Space[13] offers room for ‘crowd research’ if you are intrigued!
[11] http://imagereportsmag.co.uk/
[12] http://www.color.org/index.xalter
Numerical Comparisons
Digital Colour Brightness is the numerical representation of images that we show in our re-visualisations. As we progress, we will discover how to make best use of this ‘visual indicator’ to compare images and the technologies that produced them.
To compare microscope technologies, we obviously need to put the same ‘specimens’ under the various microscopes.
Is it appropriate to use the colour of the year images[14] that Wikipedia publishes?
Of the techniques that MicroscopeMaster describes, I am mentioning here only those where sample images are also published as I re-visualised them for this article:
- Brightfield Microscopy – the above Green Algae as sample
- Darkfield Microscope - the above Sugar Crystals
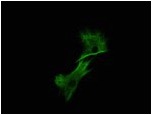
- Phase Contrast Microscope - the hemocytometer with fibroblasts below
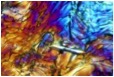
- Polarizing Microscope - Vimentin Protein
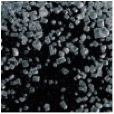
- Confocal Microscope - Artificial Sweetener crystals
[14] https://en.wikipedia.org/wiki/Pantone#Color_of_the_Year
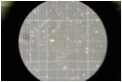 A Phase Contrast Microscope is used to measure
fibroblasts with a hemocytometer |
 Re-visualised
with more depth of structure. |
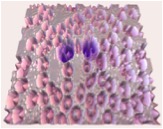
 Vimentin Protein under a Confocal microscope[15] |

Re-Visualised on http://www.smart-knowledge-portals.uk/projects/329 |
Artificial sweetener crystals in polarized light: http://www.microscopemaster.com/polarizing-microscope.html
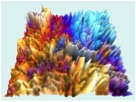
Re-Visualised on http://www.smart-knowledge-portals.uk/projects?id=330
And here ‘attenuated’
to highlight
different levels of contrast.
So the principles of comparison are:
1. Visual effects in terms of
- light, colour and contrast;
- patterns and objects above and below a ‘zero plane’;
2. Numerical inversions resulting in
- comparisons of valleys and mountains
- and the colour of the ‘zero plane’;
3. Numerical comparisons resulting in contrasting the numerical ranges of
- a particular technique;
- its magnification as it relates to length scales;
- any given image produced by that technique.
It is hoped that new references and standards will be developed as a result of online collaborations between enthusiastic microscopists who not only appreciate MicroscopeMaster but also the marvels that microscopes reveal.
More on Digital Imaging Here and info on Digital Pathology.
Return from Digital Coulour Brightness and True Colour 3D to MicroscopeMaster Home
Find out how to advertise on MicroscopeMaster!


MicroscopeMaster.com is a participant in the Amazon Services LLC Associates Program, an affiliate advertising program designed to provide a means to earn fees by linking to Amazon.com and affiliated sites.
Recent Articles
-
Deltaproteobacteria - Examples and Characteristics
Nov 01, 22 04:44 PM
 Deltaproteobacteria is a large group (Class) of Gram-negative bacteria within the Phylum Proteobacteria. It consists of ecologically and metabolically diverse members. Read more here.
 -
Chemoorganotrophs - Definition, and Examples
Oct 26, 22 05:01 PM
 Chemoorganotrophs also known as organotrophs, include organisms that obtain their energy from organic chemicals like glucose. This process is known as chemoorganotrophy. Read more here.
 -
Betaproteobacteria – Examples, Characteristics and Function
Oct 25, 22 03:44 PM
 Betaproteobacteria is a heterogeneous group in the phylum Proteobacteria whose members can be found in a range of habitats from wastewater and hot springs to the Antarctic. Read more here.